This exhibition is the culmination of nine months of research that brings together student work and design explorations investigating the relationship between the drawing and the built form. This research begins from Robin Evans’ famous observation that the greatest generative potential – and thus the most salient space of design authorship – lies not in the abstract, graphic operations of the drawing, nor in the concrete realization of the building, but rather in the translation between these two modes of architectural production. Expanding on this observation, this project explores how buildings and drawings can be brought into a more intimate relationship, with all the tension, interference, and entanglement that intimacy implies.
This project offers an alternative to the current obsession, exemplified by BIM software, wherein the drawing (as digital representation) strives to become a building; a virtual copy of the physical structure-to-be. Here, the built form strives to become a drawing, seeking to retain abstract quality and graphic language. This project exploits the unique relationship between the unrolled elevation and the massing envelope. Each can be constructed from the other through a process of folding and unfolding, promoting an exchange that links abstract patterns across spatial dimensions. Both are presented here, as a double image, each as much the project as the other, posing the question: Can we inhabit the space between drawing and form?
The project’s materials – PVC-coated mesh, clear vinyl, reflective mylar applique – were selected for their graphic quality and apparent immateriality – vibrant color, gridded lines, refracting and reflecting surfaces. The goal was to map pattern onto pattern, to overlap, multiply and distort. And yet, each of these materials brought their own narratives and provenances: mesh coated for use in lobster traps, designed both to withstand the marine environment and to attract lobsters (different colors are preferred in different seasons); vinyl designed for boat sails and canopies; mylar for car customization. Despite the appearance of abstraction, each of these materials are imbued with their own coordinates of desire – that of the lobster and the lobsterman, and that of car and yacht culture. In various small, but not unimportant ways, these lines of desire are smuggled into the project, nudging us towards what might be the true ambition of this project: to explore the space between abstraction and desire.
Exhibition Team: Benjamin Leinfelder (project lead), Josephine Wermuth, Gianfranco Pozzolini, Patrick Philbrook, Xiaoyan Elena Lang, Rutuja Girish Patil
With Support From: UMASS Department of Architecture, UMASS College of Humanities and Fine Arts, Riverdale Mills Corporation
Some key links and data regarding subdivision development in the US since the 2008 housing collapse.
The US Census 2017 Characteristics of New Housing survey provides a highly detailed collection of data regarding new housing construction during the period 2009-2017. It includes data on house and lot size, numbers constructed by type, construction types, and various systems and features (heating, plumbing, sewage, parking, etc.).
According to this survey, 61% of new single-family houses built nationwide in 2017 were part of a Homeowners Association and thus a subdivision. That has been steadily rising since 2009, when it was 46%. The area with the most subdivision development is, not surprisingly, the South and the West.
Also according to this survey, the median lot size in 2017 is 8,825 sqft, down from almost 11,000 sqft in 2009 (a change driven primarily by a reduction of lot size in the Northeast, Midwest and South). Median house floor areas has increased slightly from 2009 to 2017, from 2,135 sqft to 2,426 sqft. This is part of a much larger trend of house size increases since at least 1973, at which time the median floor area was 1,525 sqft.
The National Association of Housing Builders also carried out a survey of housing construction in 2016. According to this survey, the median subdivision size is 26 acres, 17 acres of the subdivision site dedicated to housing. With a median of 45 units per subdivision, this leads to a median distribution of 3.2 units per acre. A more recent survey by NAHB has shown that housing size has started to decrease over the past three years:
Recent articles on the demand, regulations, and economics driving the ongoing increase in housing size over the past century include:
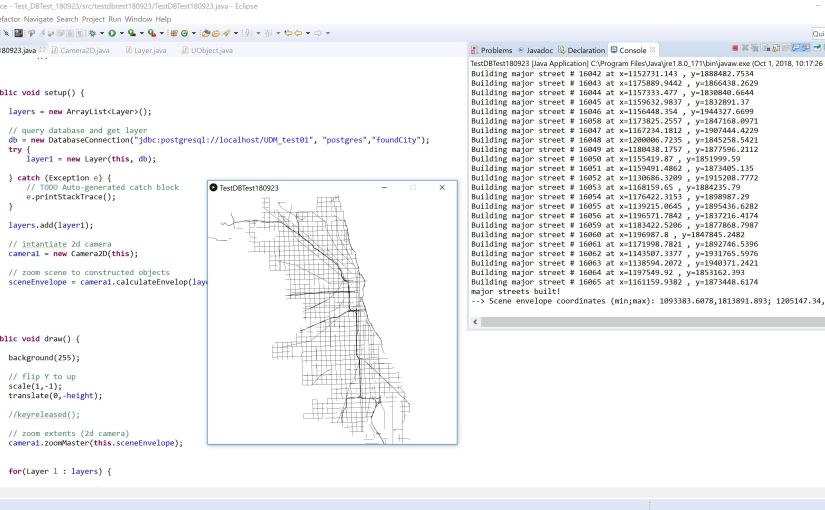
Current progress on the Urban Data Model (UDM) Platform and the Dynamic Bus Routing prototype. See the roadmap for the ongoing development of the UDM. Here is a video showing the current state of the simulation running.
The Dynamic Bus Routing prototype has now implemented the following feature:
loading of street network from a postgis database
bus traversal on the street network
definition of catchment zones based on Voronoi analysis of bus current route nodes
assignment of riders for pickup which fall into those zones
rerouting based on new rider pickup locations, and drop of locations once rider is picked up
Next steps include:
Fix the voronoi polygon union issue – current approach (polygon -> multipolygon) is fast but creates a bunch of strange boundary lines that are very distracting. Need to find a better solution for joining all the polygons to draw clean boundary lines between bus catchment zones!!!
Work on display layer issues, possibly using PGraphics objects to create multiple display “layers” – i.e. a UI layer on top, followed by an annotation layer, a draw layer, and finally a background layer on bottom.
Providing a rider handling system so that certain bus catchments don’t become too large (solving the problem that as more riders are assigned, the catchment becomes larger, causing more riders to be assigned, and so forth)
This article outlines the Octopus Pavilion, an interactive pavilion designed and installed by Jordan Kanter and Max Gerthel in 2016 as part of Beijing Design Week. This text was published in the 2018 Proceedings of the ACADIA Conference, Mexico City: Re/calibration: on imprecision and infidelity
soft is FLEXIBLE / ADAPTABLE / RECONFIGURABLE

soft is MOBILE / DISTRIBUTED / SPONTANEOUS

soft is ACCESSIBLE / OPEN / INVITING
The Octopus Pavilion project engages soft systems1 in the design of an interactive pavilion in Beijing’s historic neighborhood of Baitasi. Installed as part of the 2016 Beijing Design Week, this project employs softness as a strategy to intervene in a complex, highly informal market area of the Baitasi neighborhood. As its name suggests, this project draws on the unique evolution of the octopus as a key reference for developing a flexible, modular, interactive intervention into this contested public space.
Soft Space
Beijing is both hard and soft. It is marked by extensive physical infrastructure—ring roads, megablocks, and monumental architecture—yet it also supports a host of informal, nomadic, spontaneous systems. These include everything from mobile food carts and Weixin payment nodes to the atmospherics of air pollution and data collection. Nowhere is this more evident than in hutong areas such as Baitasi, where complex entanglements of historical, infrastructural, commercial, and social strata overlap with unexpected, often innovative, results. Exhibiting a dearth of formal public places (squares, boulevards, etc.), these neighborhoods nevertheless possess vibrant public space in a fragmented topology of informal gatherings, itinerant market stalls, and outdoor BBQ stands. The ephemeral publics found in the hutong neighborhood and other interstitial spaces in the city not only represent opportunistic and at times innovative occupation of a limited spatial resource, but also foster alternative public spheres that challenge the dominant modes of spatial politics and public discourse (Fraser 1993; Farquhar 2009; Nguyen 2017). Much of the vitality of the hutongs can be traced to the lived experience of this soft space, yet a lack of concrete anchoring makes it vulnerable to disruption.2 Work remains to provide a degree of spatial formality and durability without curtailing its improvisational energy (Leanza, 2017).
Soft Structure
Possessing pliable, boneless appendages with infinite degrees of freedom of movement, octopuses have evolved unique strategies for mapping and controlling their body. With two-thirds of their nerve cells distributed peripherally, and bundled with muscles, sensory receptors, and pigmentation cells, their mind is quite literally in their skin (Hochner 2012). This embodied intelligence, coupled with behaviors such as camouflage, mimicry, and tool-use, allows octopuses to forge highly specific, improvisational, soft affiliations with their environment (Godfrey-Smith 2016).
The pavilion consists of 29 identical modules integrates a pneumatic pillow with sensors, controllers, and inflation/deflation fans. This modularity and distributed control system allowed the allowed the pavilion to be deployed either as individual cells distributed across the neighborhood or as a unified body at a single location, in any number of arrangements to conform to complex sites. Each module was programmed to react to movement and sound, cycling through a program of inflation/deflation and LED color/intensity modulation. Adaptive programming allowed self-calibration to match the activity in the plaza, from everyday wandering to event crowds. The pneumatic, nylon construction allowed for a lightweight, pliable structure that could be quickly installed with minimal disruption to the neighborhood. This “soft tectonic” generated variable structural rigidities during inflation and deflation, creating an indeterminate, always adapting form. Modules reacted independently, but tied together as an elastic surface, their responses propagated across the canopy with macro-scale effect, deforming to the public space beneath it.
Simulation of elastic propagation across canopy
Installed over a two-week period, this project transformed a previously fenced-off plaza in the center of Baitasi’s market area into a magnet for activity. Children were quick to grasp the interactive potential of the pavilion. They incorporated it into their play, challenging each other to see who could make more modules light up or inflate. This playfulness brought the plaza to life for people of all ages, while helping to open a dialogue on use, ownership, and design of public space.
NOTES
Soft systems encompass an intellectual trajectory that challenges linear, top-down approaches, embracing adaptability, modularity, and performativity (Negroponte 1976; Kwinter 1993; Manaugh 2013). Soft systems thinking grew out of cybernetics, emerging computational paradigms, and a critique of top-down planning and management regimes in 1960s and 1970s. Reinvigorated by the emergence of pervasive information and computation technologies, as well as in response to rising apprehensions about the capacity of the neo-liberal nation-state to meet the challenges and anxieties of an interconnected, destabilized global condition in the aftermath of the twin crisis of 2001 and 2008, soft systems have found new relevancy, serving as a core paradigm for disciplines from business management to interactive design and robotics.
The tenuous nature of these public spaces was dramatically illustrated in the recent “bricking-up” campaign that effected many hutongs throughout Beijing in 2017. City government-initiated sweeps resulted in wholesale demolition of any construction deemed illegal, including a large proportion of the small shops and restaurants located throughout these neighborhoods. See: Steven Myers, A Cleanup of ‘Holes in the Wall’ in China’s Capital, New York Times, July 17, 2017
REFERENCES
Farquhar, Judith. 2009. “The Park Pass: Peopling and Civilizing a New Old Beijing.” Public Culture 21 (3): 551–76.
Fraser, Nancy. 1993. “Rethinking the Public Sphere: A Contribution to the Critique of Actually Existing Democracy.” In The Phantom Public Sphere, edited by B. Robbins, 1–32. Minneapolis: University of Minnesota Press.
Godfrey-Smith, Peter. 2016. Other Minds: The Octopus, the Sea, and the Deep Origins of Consciousness. New York: Farrar, Straus and Giroux.
Hochner, Binyamin. 2012. “An Embodied View of Octopus Neurobiology.” Current Biology 22 (20): R887–R892.
Kwinter, Sanford. 1993. “Soft Systems.” In Culture Lab, edited by Brian Boigon, 207–28. New York: Princeton Architectural Press.
Leanza, Beatrice. 2017. “Hutong, A Testing Ground for Modernization.” Arbitare 569, October 27, 2017.
Manaugh, Geoff. 2013. “Soft Serve.” in Bracket 2: Goes Soft, edited by Neeraj Bhatia and Lola Sheppard, 10–16. Barcelona: Actar Publishers.
Nguyen, Victoria. 2017. “Slow Construction: Alternate Temporalities and Tactics in the New Landscape of China’s Urban Development.” City 21 (5): 650–62.
Soft Sentience is a research collaborative operating at the intersections of neuroscience, computation, urban theory, and design. It explores new modes of representation and mapping in the space of the computationally- and cognitively- mediated city: the ways we map the city and the ways the city maps us.
The focus is on mechanisms of representation and abstraction. The basic assumption is that the brain has has no a priori structure for mapping the perception of space or time, rather it emerges out of experience and an active engagement with the world – “scanning the landscape and learning to think”. Extending out to the city, this idea of abstraction is considered both from the perspective of embodiment – projecting-in to create models or maps of the world – and enactment – projecting-out to construct or produce the world based on these maps. We are interested in how these two mechanisms entangle, particularly in the context of the increasing dispersion of autonomous and partially autonomous agency in the fabric of the city.
These issues are explored through the intersection of multiple discourses, techniques, and modes of inquiry, drawing on geospatial analysis, critical cartography, agent-based modeling, physical computing, machine learning, genetic neurology, cognitive mapping, spatial learning, and more.
The approach to generating this data brings up issues of accuracy and validation. The Nytimes mappers address this to some degree, discussing how they addressed inaccurate tracing of building footprints by replacing areas where better data was available. This approach of validating across multiple data sets is of course an essential part of geodata modeling, and something we often discussed with students – part of the broader “author your own data” initiative, which encourages the interrogation of existing data, and the generation of new data on the ground as a way to take ownership of the regimes of data production and visualization, and the agency derived therein.
What is perhaps most interesting here is the ways computer vision takes on an increasing function in the interpretation – and design – of the world, as computational systesms are endowed with the ability to “sense the world and learn to think” (to paraphrase Ben Bratton). What does it mean to design objects (buildings or otherwise) that respond not just to the human visual sensitivity, but also to computational visual biases? Will driverless car visioning make us rethink Kevin Lynch’s characteristics of a “well imaged city”? Will building footprints and the figure-ground relationships of the city be transformed through the eye of OpenStreetMap’s all seeing and now all drawing eye? What do urban features – building, parks, cars, benches, trees, etc. look like to an AI vision system – and will these non-human “aesthetics” have any impact on how objects are designed?
On another note, another great post from Derek Watkins from the NYTimes discussing the challenges and computational approaches involved in displaying super-high resolution simulations of Antarctic ice flows with web motion graphics:
A map is not the territory it represents, but, if correct, it has a similar structure to the territory, which accounts for its usefulness.
— Alfred Korzybski, Science and Sanity, 1931
We will kick off the Soft Sentience Working Group (for lack of a better name) with the question: “what is a map?” The first session will focus on the concept of cognitive mapping, exploring the relationship between the map and the territory it seeks to represent, understood both from social theory and fundamental neuroscience research. This begins to address one of the two working definitions we have forwarded for the map, what we had referred to as embodiment – projecting in to create a working representation of the world. Each of the readings included address this in one way or another – i.e. how we situate ourselves in the world vis-à-vis the maps we draw (in our heads or elsewhere), and the limits of these representations.
This session’s readings include the first chapter of the classic text The Image of the City by Kevin Lynch. This chapter outlines Lynch’s broader understanding of the interrelation between our cognitive maps and the shape and legibility of the city. Other chapters from this book will be added soon. The second piece, by Marxist and Post-Modern social theorist Fredrick Jameson, takes up Lynch’s idea of the cognitive map, expanding it to describe mental and social processes we use to bridge the gap between everyday experience and the larger social and economic order (i.e. “ideology”). Also included is a This American Life episode on mapping that explores how different kinds of maps – and thus different images of the world – can be generated through different sensorial regimes, with great pieces by the cartographer Denis Wood and the late, great Los Angeles food critic Jonathan Gold.
Scientific texts include two foundational texts for the “cognitive map” theories of the brain. The first is from Edward Tolman (1950s). The psychology building at Berkeley is named after him and he not only fought the battle (lost the battle in his lifetime but has now been vindicated by modern neuroscience) against B.F. Skinner and the Pavlovian stimulus-response behavioral absolutists, he also got thrown out of his Professorship at Berkeley during the Red Scare for refusing to sing a loyalty oath and standing with the students; he was eventually re-instated after going to court. Also included is two chapters from the classic 1970s book by John O’Keefe, discoverer of place cells, on the discovery and neurology of the hippocampus as the site of cognitive maps.
Reading
Kevin Lynch, The Image of the City, 1960, pp 1-14 + additional chp TBD
view scaling and translation to extents of envelope
interactive zoom/pan with keyboard
interactive zoom/pan with mouse (need to disentangle this functionality from the main p5 App class using native Java mouseListener class)
Next steps:
clean up architecture of UObject package: How to handle geometry in UObjects? Should UObjects be able to contain multiple geometries? Should all geometry draw functions be handled through inheritance of standard Geotools geometry objects – i.e. outside of UObjects?
Set up graph network layer – to what extent can Geotools classes be used/extended from here?
How to handle object display scaling issues with zoom functions?
migrate code to github
set up online PostGIS database and start testing remote access
This is the preliminary class diagram for the UDM platform. The main goals in my mind in how this should be constructed is to make the structure as flat as possible, while still allowing it to be flexible to future changes and added complexity. This builds off the approach of Processing to create lean coding environments that are easily accessible to designers.
As the UDM is envisioned as a pedagogical tool as much as a design tool, its structure is intended as an introduction to basic Object Oriented programming (and design) paradigms. Key principles, such as inheritance, composition, “encapsulating what changes”, etc. are viewed as both as a way to ensure code reuseability and reconfigurability, as well as teaching tool for introducing and developing Object Oriented Design as an urban strategy – i.e. “Object Oriented Urbanism.” A key point of encapsulation includes the state objects, which define object behaviors, and ensure that any behavior can be reused, replaced and/or overlapped.
The UDM will be built with GeoTools library, which provides geometry types and the full functionality of a GIS platform.


 roads, megablocks, and monumental architecture—yet it also supports a host of informal, nomadic, spontaneous systems. These include everything from mobile food carts and Weixin payment nodes to the atmospherics of air pollution and data collection. Nowhere is this more evident than in hutong areas such as Baitasi, where complex entanglements of historical, infrastructural, commercial, and social strata overlap with unexpected, often innovative, results. Exhibiting a dearth of formal public places (squares, boulevards, etc.), these neighborhoods nevertheless possess vibrant public space in a fragmented topology of informal gatherings, itinerant market stalls, and outdoor BBQ stands. The ephemeral publics found in the hutong neighborhood and other interstitial spaces in the city not only represent opportunistic and at times innovative occupation of a limited spatial resource, but also foster alternative public spheres that challenge the dominant modes of spatial politics and public discourse (Fraser 1993; Farquhar 2009; Nguyen 2017). Much of the vitality of the hutongs can be traced to the lived experience of this soft space, yet a lack of concrete anchoring makes it vulnerable to disruption.2 Work remains to provide a degree of spatial formality and durability without curtailing its improvisational energy (Leanza, 2017).
 with muscles, sensory receptors, and pigmentation cells, their mind is quite literally in their skin (Hochner 2012). This embodied intelligence, coupled with behaviors such as camouflage, mimicry, and tool-use, allows octopuses to forge highly specific, improvisational,